Global Salary Transparency in Job Postings 2026
An in-depth analysis of salary transparency across different countries and US states, based on data from over 5.7 million job listings collected between February and April 2026.
Global Salary Transparency in 2026
Our analysis of more than 5.7 million job postings from 200,000+ company career sites, collected between February and April 2026, shows how openly employers around the world disclose pay in their job advertisements.
Key Global Findings
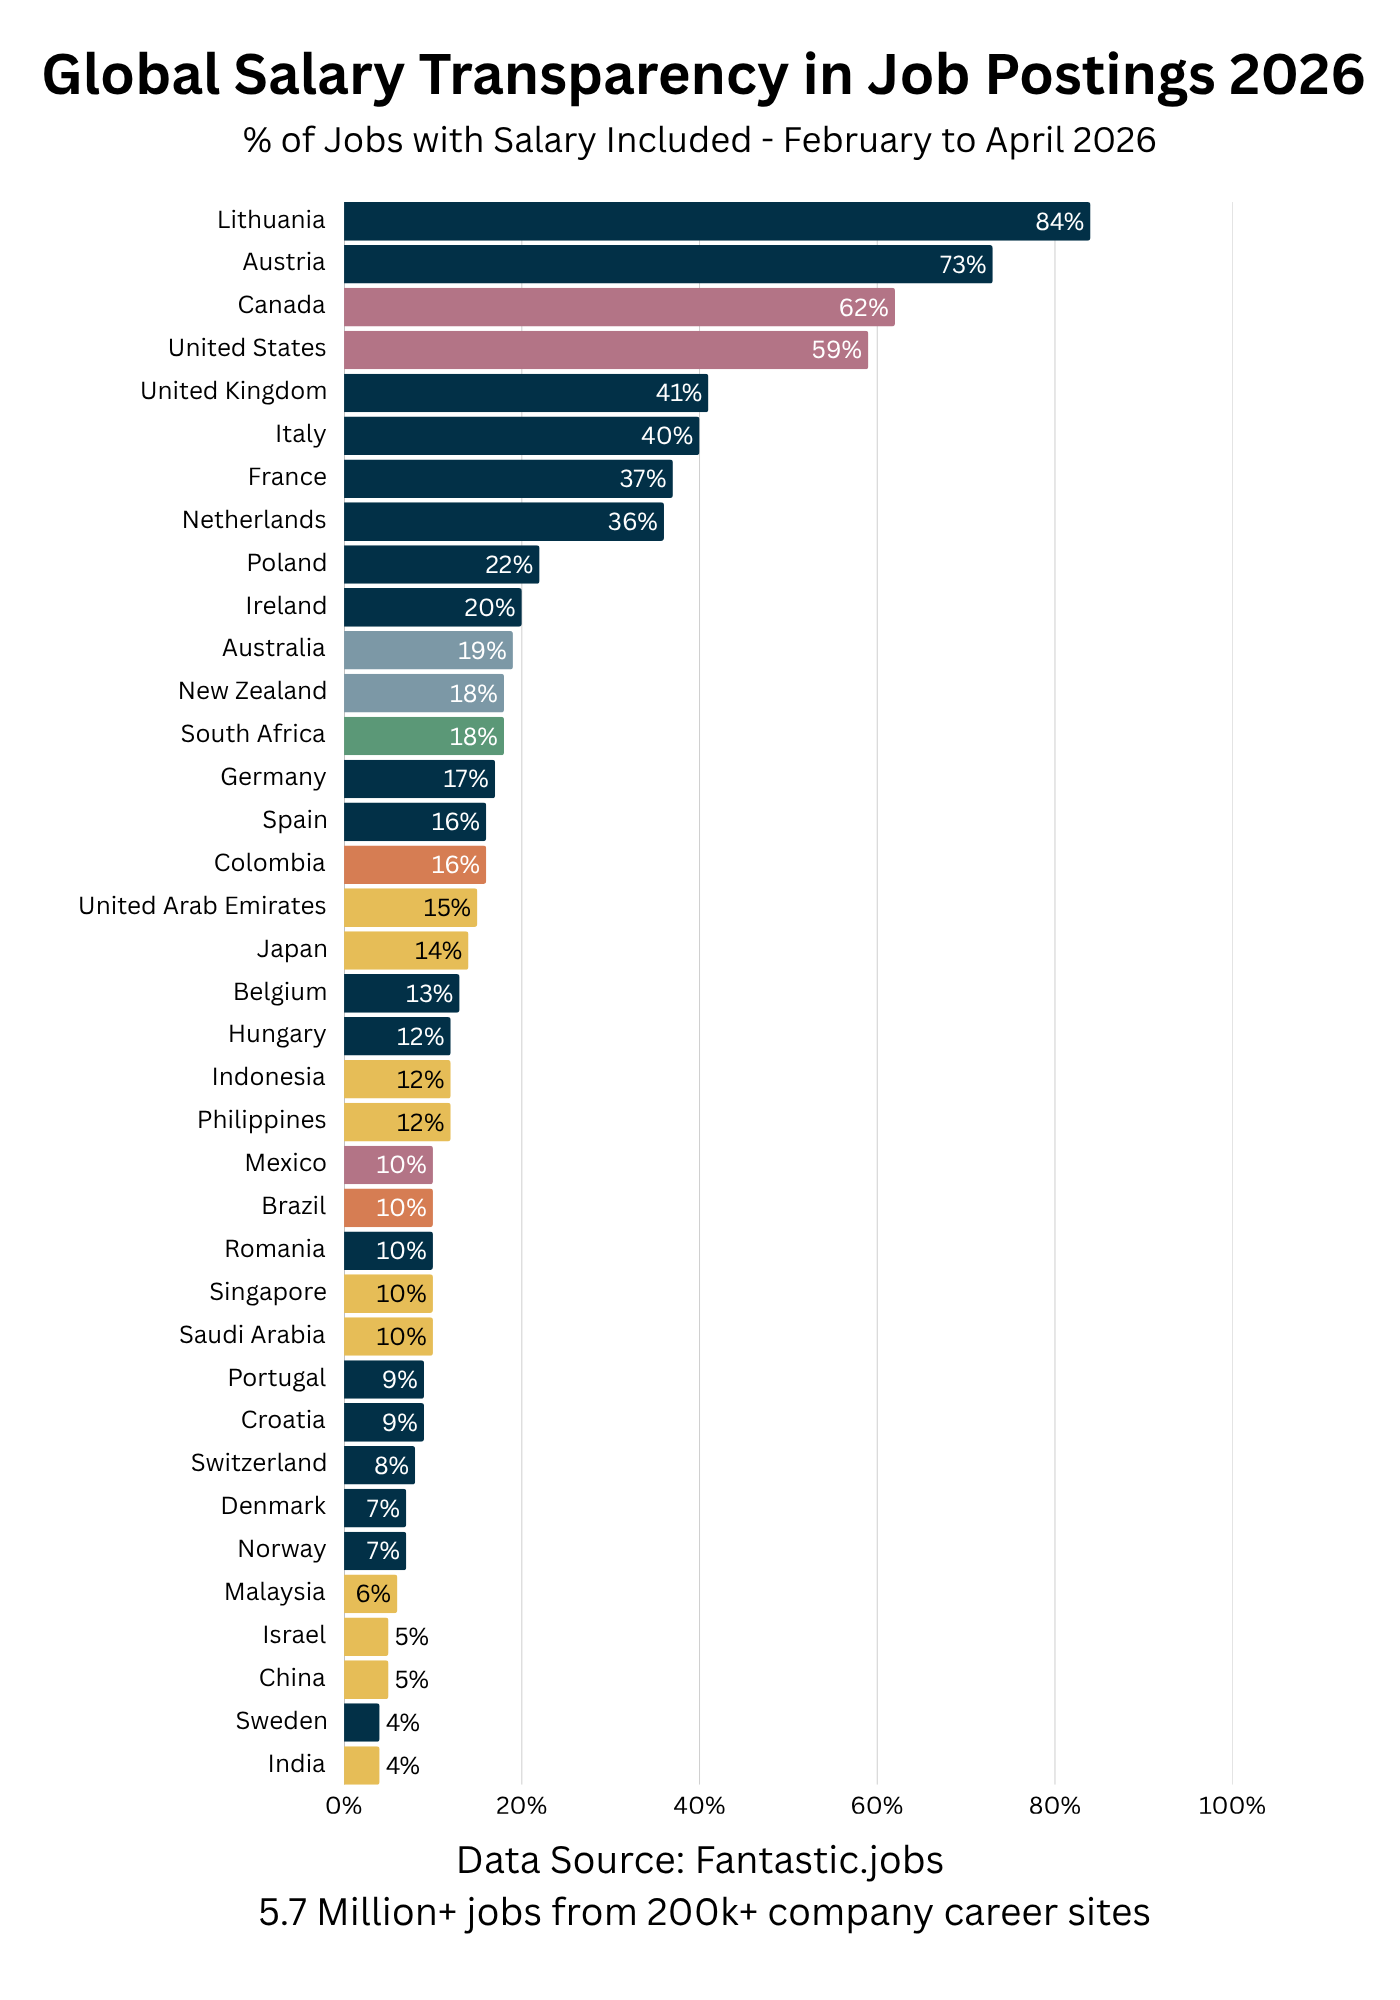
Lithuania is the global leader, with 84% of job postings including salary information — a level driven by national legislation requiring employers to publish pay ranges in vacancy ads.
Austria ranks second at 73%, supported by mandatory minimum salary disclosure rules under the Equal Treatment Act.
In North America, Canada sits at 62% and the United States at 59%, both shaped by a patchwork of state and provincial pay disclosure laws.
The United Kingdom (41%), Italy (40%), France (37%) and the Netherlands (36%) form a middle tier where pay disclosure is common but not the default.
Regional Breakdown
Europe
- Lithuania (84%) and Austria (73%) sit far ahead of the rest of the continent.
- Western Europe is mixed: France at 37%, the Netherlands at 36%, Germany at 17% and Belgium at 13%.
- Southern Europe ranges from Italy at 40% to Spain at 16%.
- Eastern Europe outside Lithuania is more modest, with Poland at 22%, Hungary at 12%, Romania at 10% and Croatia at 9%.
- Nordic countries are among Europe's lowest: Denmark and Norway at 7%, Sweden at 4%.
- Switzerland sits at just 8%.
Asia-Pacific
- Australia (19%) and New Zealand (18%) lead the region.
- Japan is at 14%, with Indonesia and the Philippines both at 12%.
- Singapore is at 10% and Malaysia at 6%.
- China (5%) and India (4%) are among the least transparent markets worldwide.
Middle East, Africa and Latin America
- South Africa posts a regional high of 18%.
- Colombia leads Latin America at 16%, ahead of Mexico and Brazil (both 10%).
- United Arab Emirates sits at 15% and Saudi Arabia at 10%.
- Israel comes in at 5%, among the lowest globally.
US State-by-State Analysis
Salary transparency varies widely across the United States, shaped by state-level pay disclosure laws, industry mix and the prevalence of remote-friendly employers.
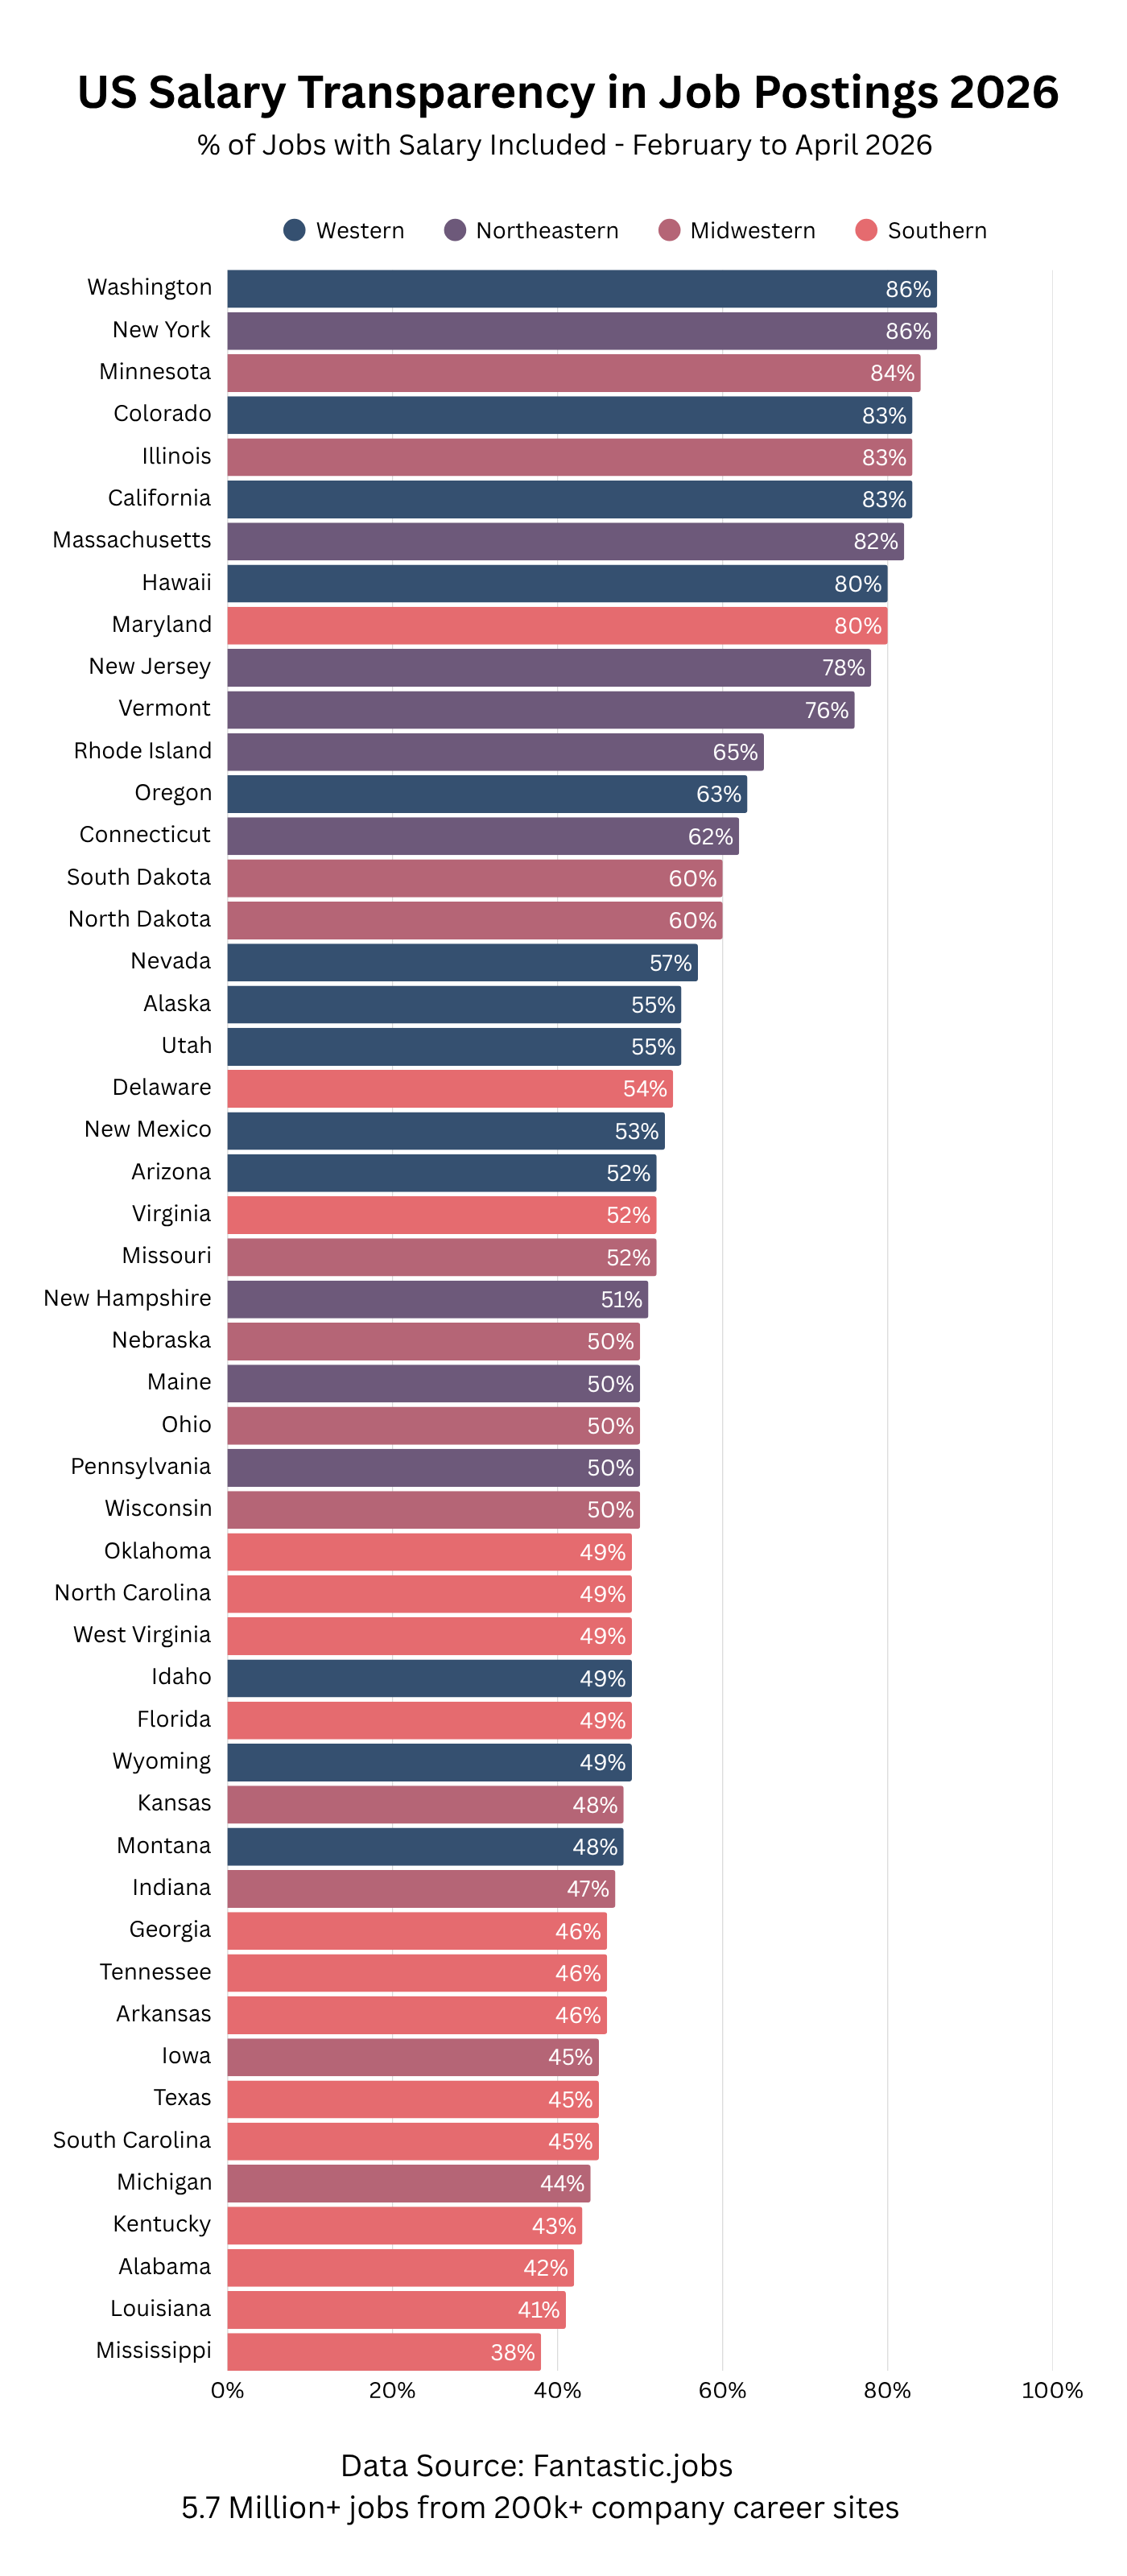
Top 10 Most Transparent States
- Washington – 86%
- New York – 86%
- Minnesota – 84%
- Colorado – 83%
- Illinois – 83%
- California – 83%
- Massachusetts – 82%
- Hawaii – 80%
- Maryland – 80%
- New Jersey – 78%
Bottom 10 States
- Mississippi – 38%
- Louisiana – 41%
- Alabama – 42%
- Kentucky – 43%
- Michigan – 44%
- South Carolina – 45%
- Texas – 45%
- Iowa – 45%
- Arkansas – 46%
- Tennessee – 46%
Regional Patterns
Western States
The West holds the top of the rankings. Washington (86%), Colorado (83%), California (83%) and Hawaii (80%) all rank in the top tier, alongside states with strict pay disclosure laws. Other Western states include Oregon (63%), Nevada (57%), Alaska (55%), Utah (55%), New Mexico (53%), Arizona (52%), Idaho (49%), Wyoming (49%) and Montana (48%).
Northeast Corridor
The Northeast is the most consistently transparent region. New York (86%), Massachusetts (82%), New Jersey (78%) and Vermont (76%) lead the group, with Rhode Island (65%), Connecticut (62%), New Hampshire (51%), Maine (50%) and Pennsylvania (50%) rounding it out.
Midwest
The Midwest is anchored by Minnesota (84%) and Illinois (83%), both in the national top tier. South Dakota (60%) and North Dakota (60%) outperform many larger markets, while Missouri (52%), Nebraska (50%), Ohio (50%), Wisconsin (50%), Kansas (48%), Indiana (47%), Iowa (45%) and Michigan (44%) sit closer to the middle of the pack.
Southern States
The South posts the lowest rates in the country, with Mississippi (38%) at the bottom. Louisiana (41%), Alabama (42%), Kentucky (43%) and South Carolina (45%) also rank near the bottom. Maryland (80%) and Virginia (52%) are notable outliers on the higher end of the regional range.
What Shapes Salary Transparency
Three factors stand out across the data:
- Legislation is the strongest predictor. Markets with mandatory disclosure rules — Lithuania, Austria, Washington, New York, Colorado, California and Illinois — sit at the top of the rankings.
- Cross-border hiring raises the bar. Multinational employers often default to publishing pay ranges to stay compliant across jurisdictions, lifting disclosure rates in countries without local mandates.
- Candidate expectations matter. Job seekers increasingly skip listings without pay information, pushing employers in competitive markets to disclose ranges voluntarily.
Key Takeaways
- Lithuania is the global leader at 84%, ahead of Austria at 73%.
- North America is the most transparent large region, with Canada at 62% and the US at 59%.
- The Nordic countries are among the least transparent globally, with Sweden at just 4%.
- In the US, the West, Northeast and parts of the Midwest dominate the top of the rankings.
- The South holds nine of the ten lowest-ranked US states, with Mississippi at the bottom at 38%.
Methodology
This analysis is based on 5.7 million+ job postings collected from 200,000+ company career sites between February and April 2026. A posting is considered transparent when it includes either a specific salary figure or a salary range. Country and state classifications are based on the primary work location specified in each posting.